In this section of The Solute, we take a look at films over the course of time by the fives. In this entry, we look at all of the top five films at the box office in March for the past 30 years.
March 1985
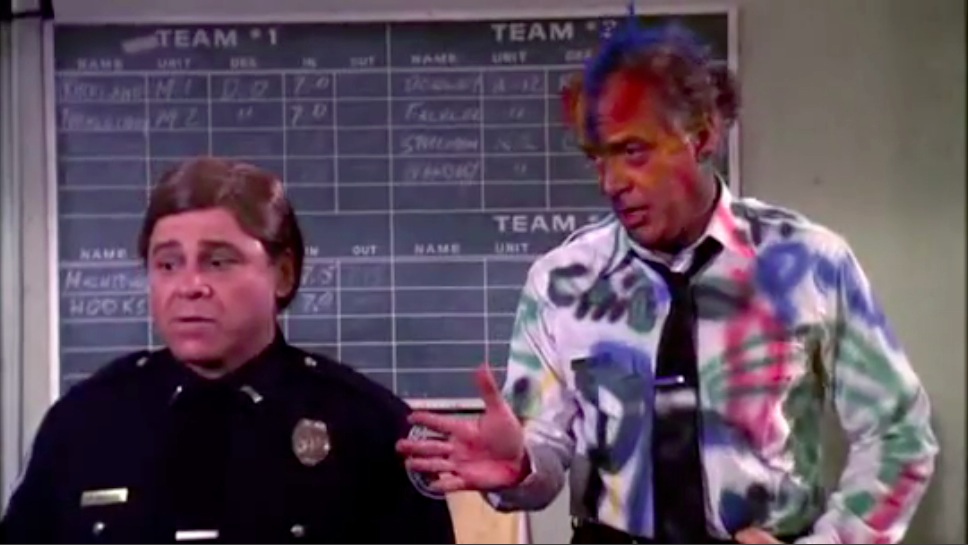
1. Police Academy 2: Their First Assignment – $55m – 1,613 screens
2. Mask – $48m – 1,024 screens
3. Desperately Seeking Susan – $27m – 1,108 screens
4. The Last Dragon – $25m – 1,039 screens
5. The Care Bears Movie – $22m – 1,003 screens
March 1990
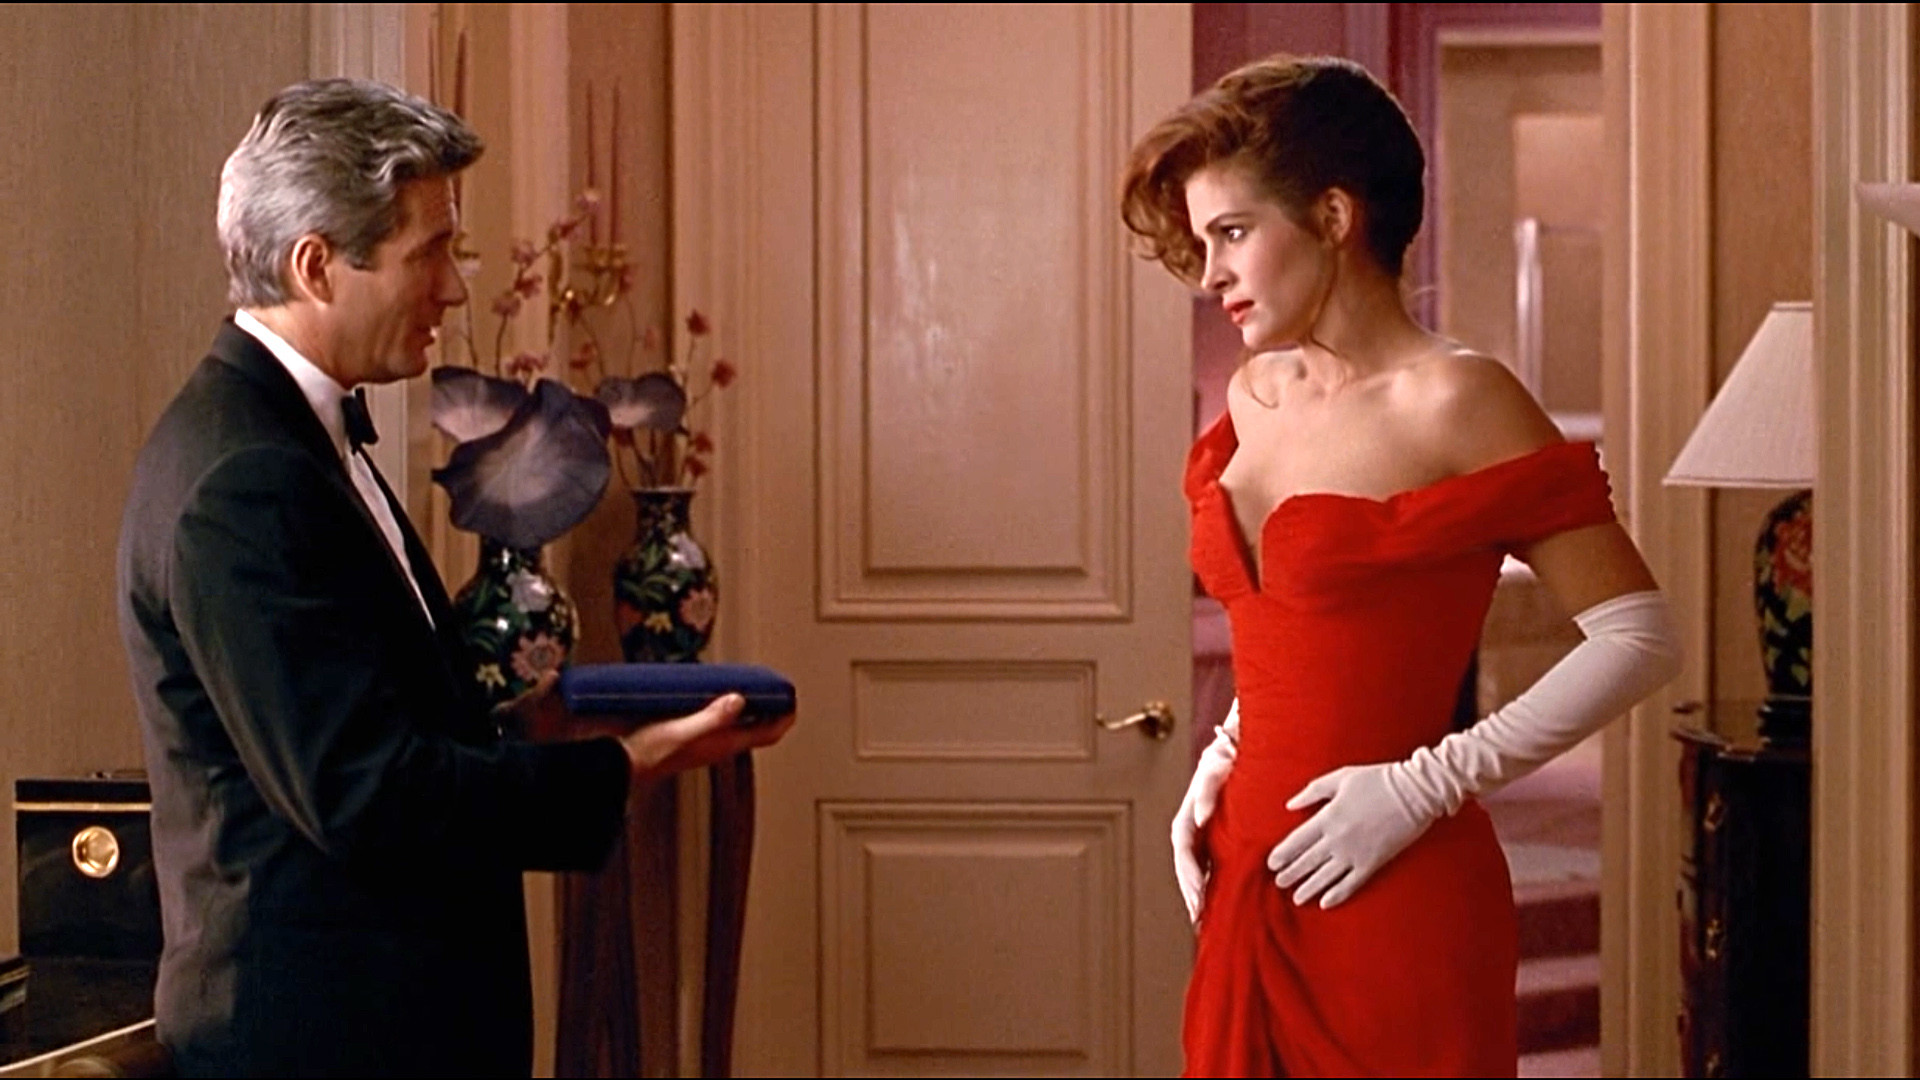
1. Pretty Woman – $178m – 1,811 screens
2. Teenage Mutant Ninja Turtles – $122m – 2,377 screens
3. The Hunt For Red October – $122m – 1,817 screens
4. Joe Versus the Volcano – $39m – 1,802 screens
5. House Party – $26m – 700 screens
March 1995
1. Outbreak – $67m – 2,230 screens
2. Man of the House – $40m – 2,059 screens
3. Tommy Boy – $32m – 2,186 screens
4. Major Payne – $29m – 1,991 screens
5. Dolores Claiborne – $24m – 1,256 screens
March 2000
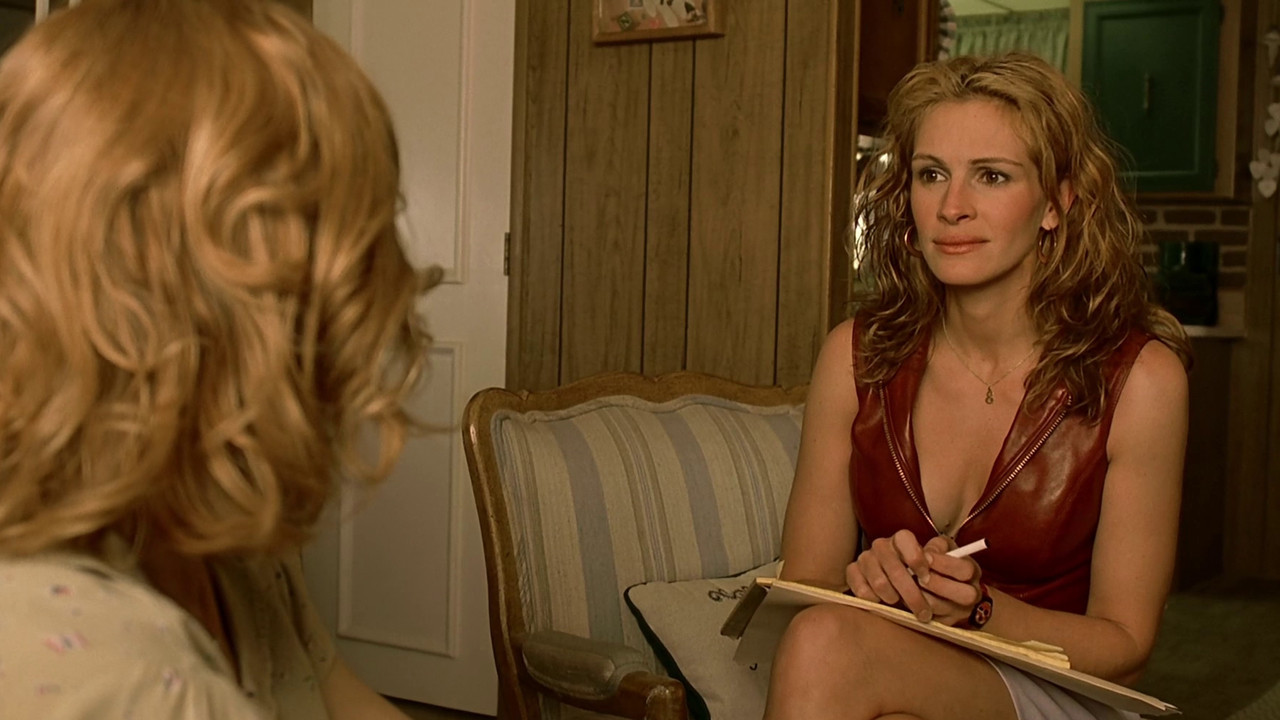
1. Erin Brockovich – $125m – 3,070 screens
2. Mission to Mars – $60m – 3,101 screens
3. Romeo Must Die – $55m – 2,641 screens
4. Final Destination – $53m – 2,587 screens
5. The Road to El Dorado – $50m – 3,223 screens
March 2005
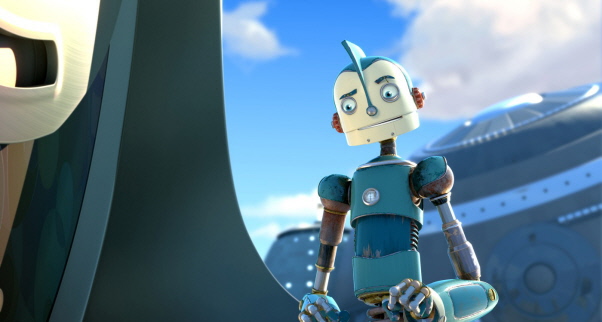
1. Robots – $128m – 3,776 screens
2. The Pacifier – $113m – 3,181 screens
3. The Ring Two – $76m – 3,341 screens
4. Guess Who – $68m – 3,147 screens
5. Be Cool – $56m – 3,216 screens
March 2010
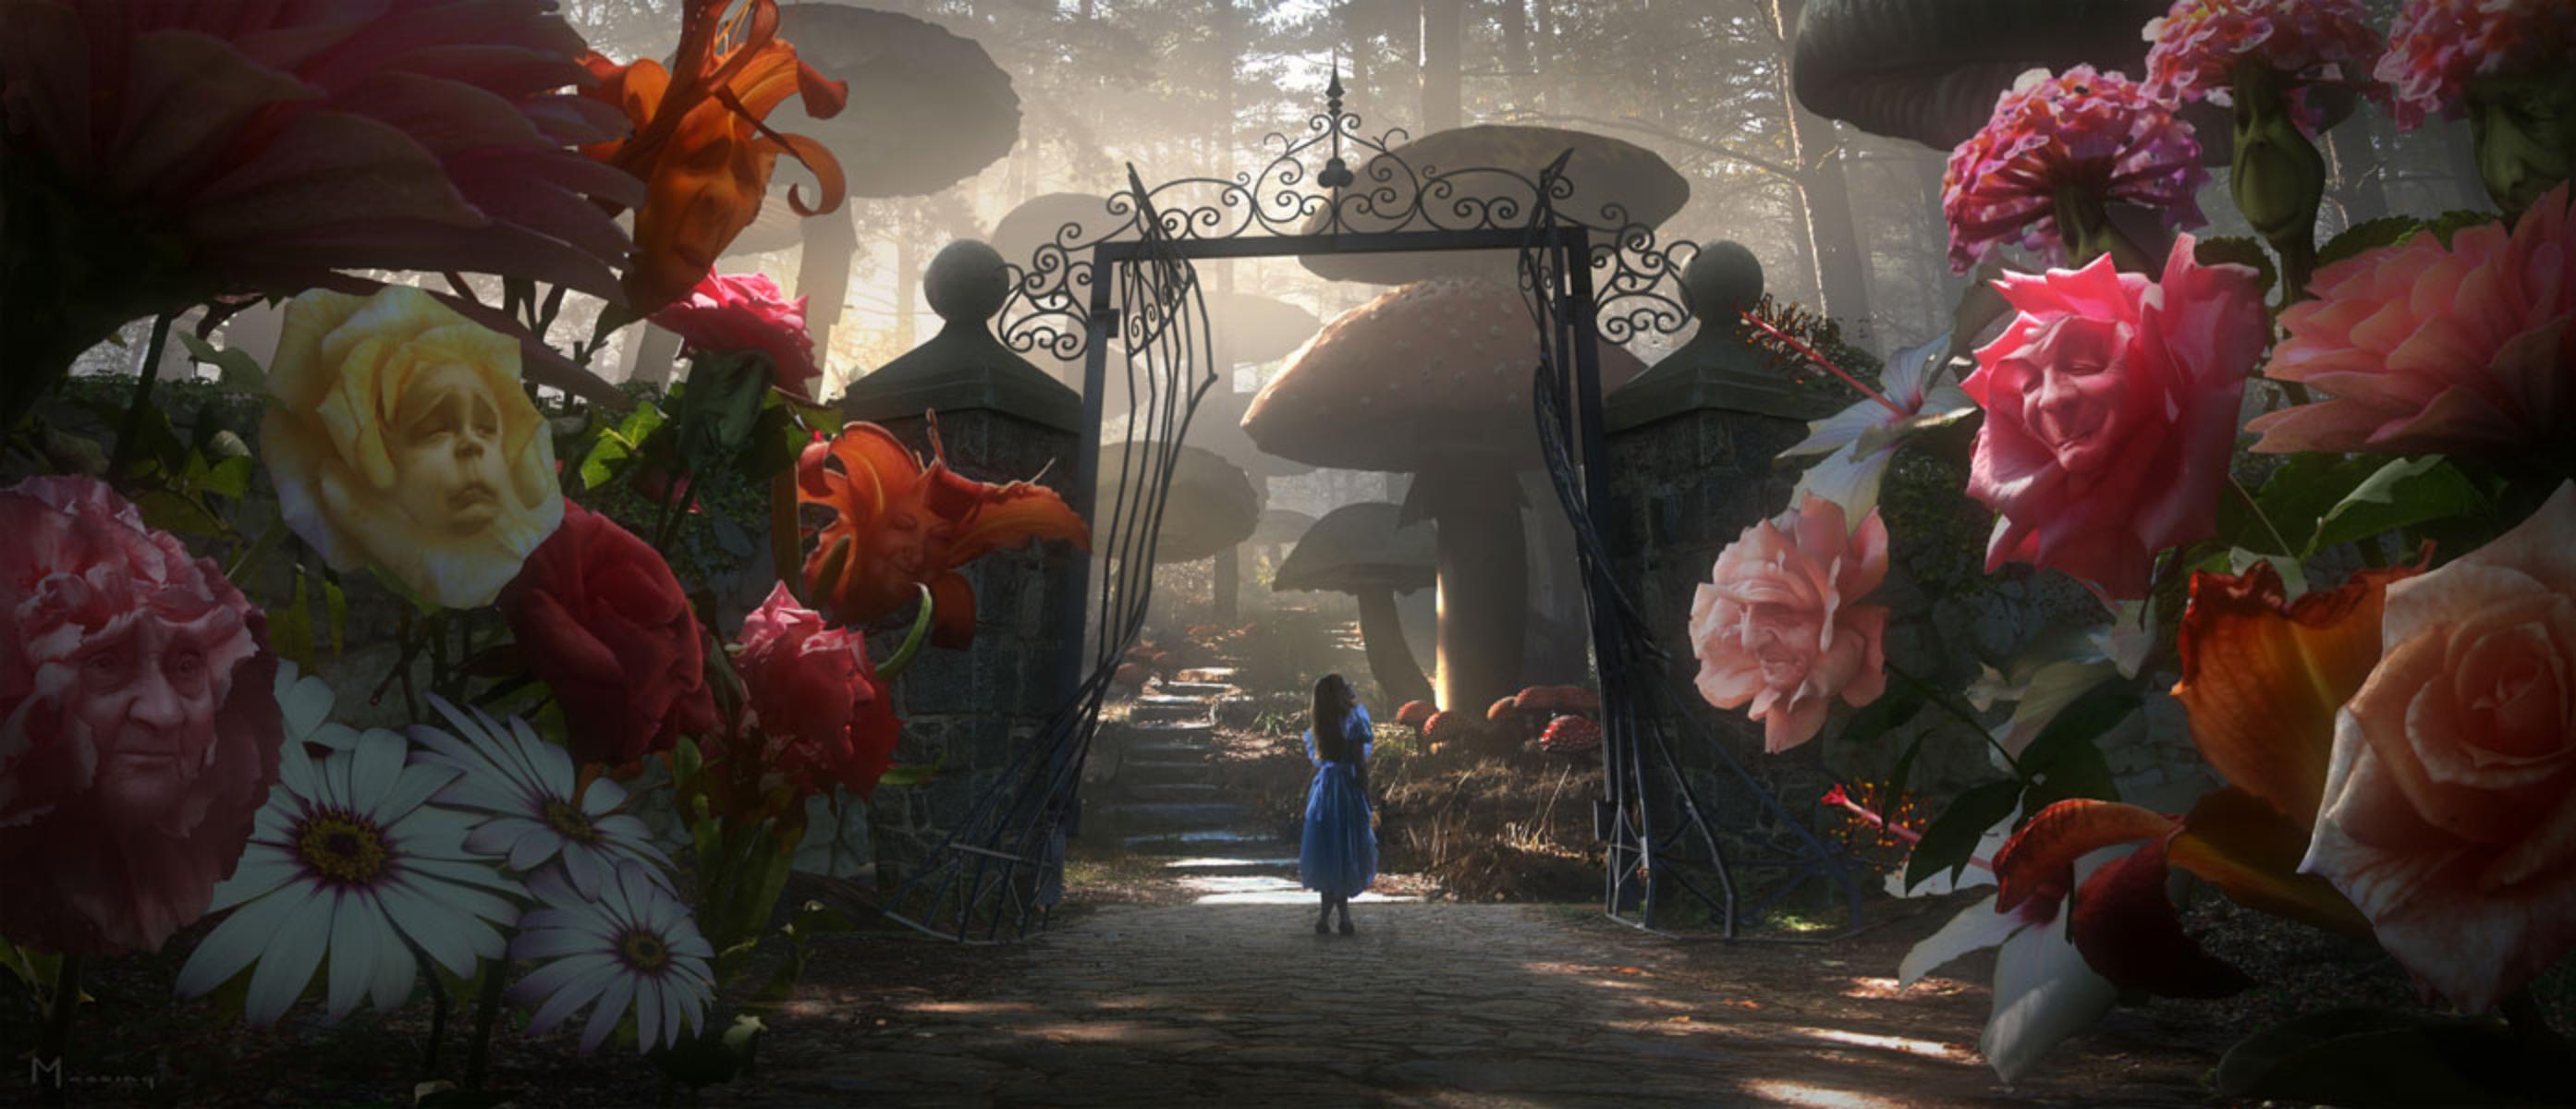
1. Alice in Wonderland (2010) – $334m – 3,739 screens
2. How to Train Your Dragon – $217m – 4,060 screens
3. The Bounty Hunter – $67m – 3,118 screens
4. Diary of a Wimpy Kid – $64m – 3,083 screens
5. The Last Song – $62m – 2,794 screens
March 2015
(Total box office to date)
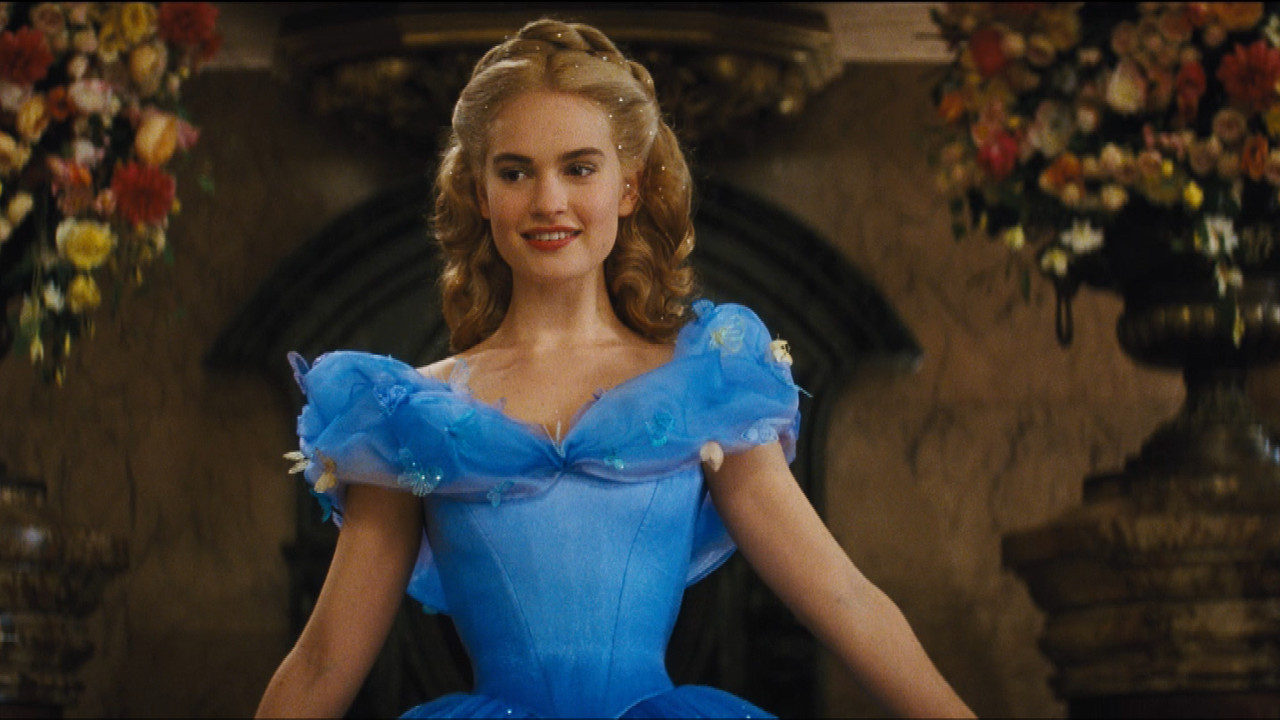
1. Cinderella (2015) – $167m – 3,848 screens
2. The Divergent Series: Insurgent – $103m – 3,875 screens
3. Home – $95m – 3,801 screens
4. Get Hard – $57m – 3,212 screens
5. Chappie – $30m – 3,201 screens

